 View as PDF
Polls and the Margin of Error
Let us suppose that 36% of respondents in the poll decided to vote candidate A and the margin of error for the survey published by the researchers is 3%. Then the survey shows that the ’true’ percentage of people decided to vote for the candidate is somewhere in the interval between 36 - 3 = 33% and 36 + 3 = 39%. It is as simple as that, as long as we believe there is a ’true’ percentage and we do not question the 3% error.
If you ask an eligible voter on the street whom would he/she vote five minutes later, you may get an answer different from the first one. Not because the voter is a liar, but simply he/or she does not care. Despite of that, the belief in existence of the true percentage of decided voters is no objection in the practical use of a poll result. Finding the margin of error, and consequently the pool where this percentage lives despite the variable mood of the voters, is more important.
To explain the margin of error calculation we switch from percentages to proportions. That means, the true percentage is calculated as 100p, where p is the true proportion of decided voters in the total of all eligible ones. If the survey asks for opinion only n voters and just x of them say they choose the candidate A then x∕n is an estimate of p and 100x∕n is an estimate of the true percentage of decided voters. Technically, some rounding is involved to get a percentage without decimals.
The formula for the margin of error commonly assumes that voters are chosen for the poll randomly, their answers are independent from each other, the chance of a vote for A is p, and the answers are written down as a series of zeros and ones. Zero means the answer is ’A no’ and one otherwise. Undecided voters are excluded from the poll. The assumption can be made more realistic by using special sampling techniques, such as randomization, stratification etc.
Under the above assumptions, the answers follow the same model as independent draws from an urn containing black and white balls. The ball is returned after each draw. This model is described by the so-called binomial distribution with expectation np and variance np(1 - p). Due to the central limit theorem, if the sample size n is sufficiently large, then
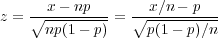
is approximately a normal random variable and the probability of z occurring in the interval (-1.96, 1.96) is approximately 0.95. In other words, the interval

covers the true proportion p with probability 0.95, or in about 95 cases out of 100, if you wish, and the interval

covers the true percentage of decided voters accordingly.
The quantity
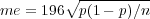
is known as the margin of error. Since the proportion p is unknown, the value p is in calculations replaced by the proportion x∕n.
One question people often ask is: how many respondents must enter the poll in order the margin of error me does not exceed, say, the 3%? An approximate answer, based on the above considerations, is obtained as follows. If we knew p in advance then the answer would be simple (c.f. me):
![[ ] 196-×-196)p(1--p) n = (3× 3) ,](education/marginformulas/margin4x.png)
where the squared brackets indicate that we must round to the nearest integer, which is larger than the bracketed fraction. For an unknown p we must consider the probability for which p(1 - p) is the largest, which is 0.5. If p = 0.5 then
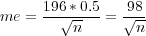
and that yields
![[98 ×98 ] n = -3-×3-- = 1068](education/marginformulas/margin6x.png)
Hence, if a survey company wants to claim a margin of error not exceeding 3% in the poll indicated above, then the investigators must get answers from at least 1068 randomly selected respondents.
 Other Sources
Margin of Error and Opinion Poll on Wikipedia.