Simple linear regression statistics on timeseries data of average monthly temperatures in Gravette, Arkansas. A positive slope and increasing trend line indicate a possibility of warming, a negative slope and decreasing trend line indicate cooling. A statistical validation of the model is necessary for the results to be of scientific value. Summary statistics of the samples used for the calculations are here. To convert the results in degrees of Fahrenheit, click here.
| Jan | Feb | Mar | Apr | May | Jun | Jul | Aug | Sep | Oct | Nov | Dec | |
|---|---|---|---|---|---|---|---|---|---|---|---|---|
| Lower Bound | -3.68 | -0.37 | -1.68 | 0.24 | -0.59 | -0.37 | 0.33 | -0.86 | -1.92 | -1.31 | -2.27 | -0.90 |
| Estimated Change | -1.72 | 1.55 | 0.23 | 1.41 | 0.44 | 0.72 | 1.40 | 0.32 | -0.70 | -0.12 | -0.85 | 0.67 |
| Upper Bound | 0.25 | 3.47 | 2.14 | 2.58 | 1.48 | 1.80 | 2.46 | 1.50 | 0.52 | 1.07 | 0.57 | 2.23 |
 Long-Term Temperature Changes and Trends
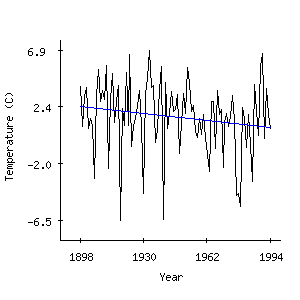
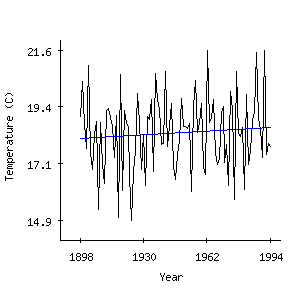
January temperature changes -1.72°C per 100 years. The true change will be between -3.68°C and 0.25°C with 95% likelihood.
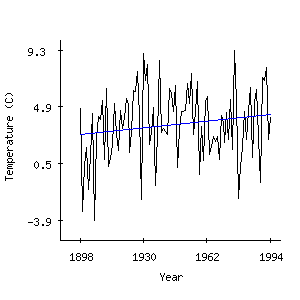
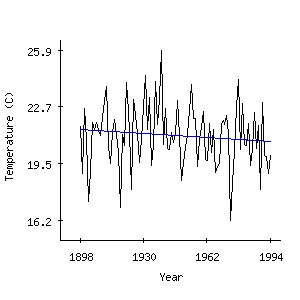
February temperature changes 1.55°C per 100 years. The true change will be between -0.37°C and 3.47°C with 95% likelihood.
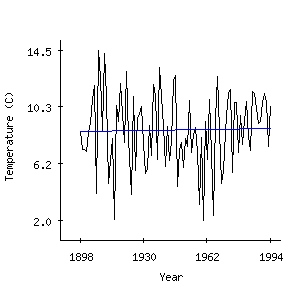
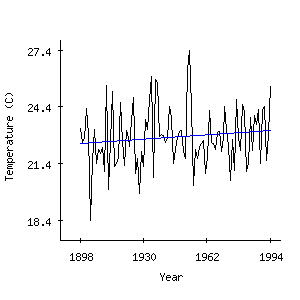
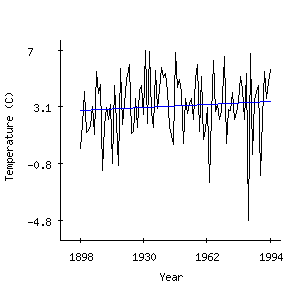
March temperature changes 0.23°C per 100 years. The true change will be between -1.68°C and 2.14°C with 95% likelihood.
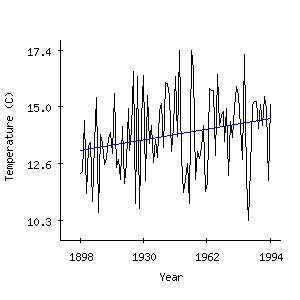
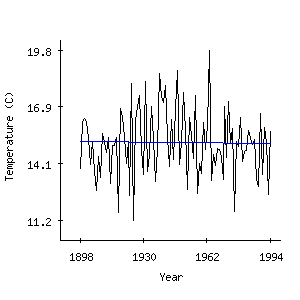
April temperature changes 1.41°C per 100 years. The true change will be between 0.24°C and 2.58°C with 95% likelihood.
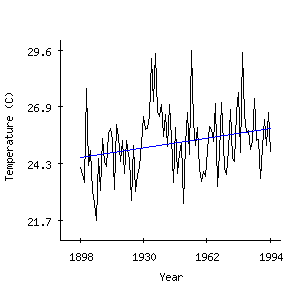
May temperature changes 0.44°C per 100 years. The true change will be between -0.59°C and 1.48°C with 95% likelihood.
June temperature changes 0.72°C per 100 years. The true change will be between -0.37°C and 1.80°C with 95% likelihood.
July temperature changes 1.40°C per 100 years. The true change will be between 0.33°C and 2.46°C with 95% likelihood.
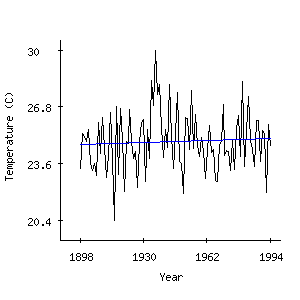
August temperature changes 0.32°C per 100 years. The true change will be between -0.86°C and 1.50°C with 95% likelihood.
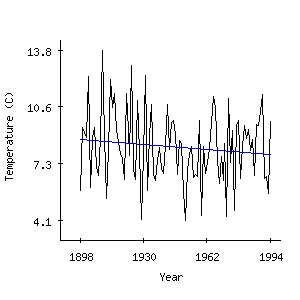
September temperature changes -0.70°C per 100 years. The true change will be between -1.92°C and 0.52°C with 95% likelihood.
October temperature changes -0.12°C per 100 years. The true change will be between -1.31°C and 1.07°C with 95% likelihood.
November temperature changes -0.85°C per 100 years. The true change will be between -2.27°C and 0.57°C with 95% likelihood.
December temperature changes 0.67°C per 100 years. The true change will be between -0.90°C and 2.23°C with 95% likelihood.